Statistics & Dashboard |
Dashboard gives you a way to know how the software is used. You can move the mouse pointer to the donut or area chart diagram to see the details.
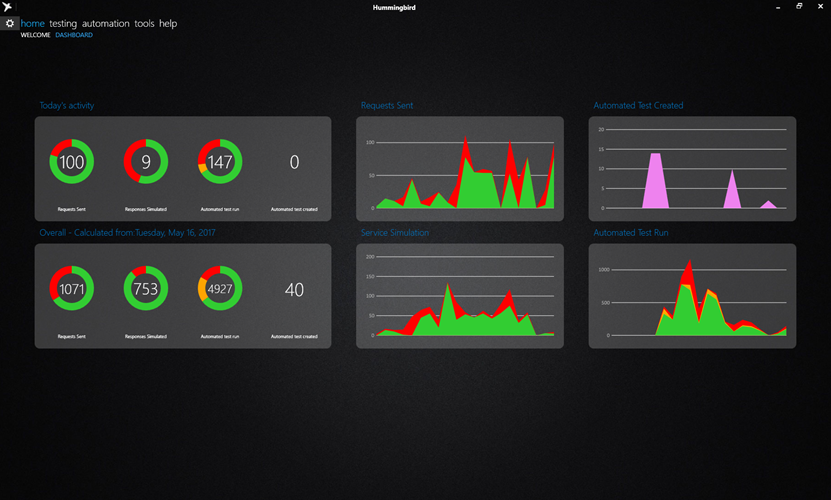
Statistics show the Daily or Overall usage of the application for the 4 important indicators: Request sent, Responses simulated, Automated test created and Automated executed.
Today's activity: Show the activity of current day.
Overall activity: Shows indicators calculated from the date of first launch of Hummingbird (or the last date that the statistic counters are reset).
Usage history show the detailed information of the 4 indicators day by day.
Days without any statistics - such as week-ends and holidays - will not be shown.